Forecast Indicator
Identifies dominant price cycles via spectral analysis and projects them forward as visual forecasts with color-coded predictions.
- SKU: forecast-indicator-010FM
- Categories:Indicator,Forecast
- Tags: Indicator, Forecast, Cycles, cTrader, Forex, Spectral Analysis
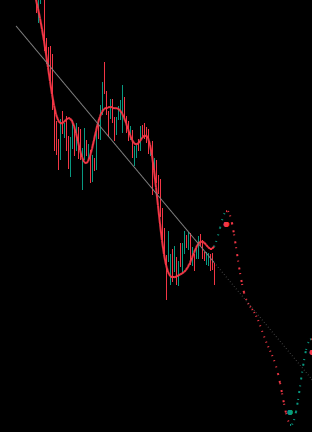
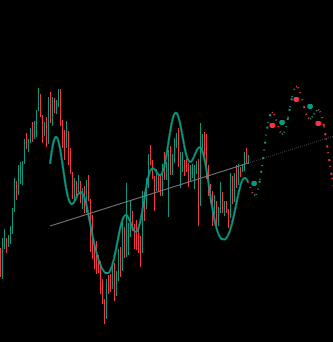
This indicator uses periodogram spectral analysis and Ordinary Least Squares regression to identify dominant price cycles and project them forward as visual forecasts. It operates through three stages: cycle detection via periodogram analysis, composite model fitting using multiple sinusoidal components, and forward extrapolation with color-coded predictions.
Core Features-
Adaptive Cycle Detection
Automatically identifies the strongest periodicities in current market data. -
Multi-Harmonic Composite Forecast
Superimposes up to 10 sinusoidal components for complex price patterns. -
Color-Coded Forecast Line
Green for projected up-moves, red for projected down-moves. -
Reversal Dot Markers
Highlights predicted turning points (peaks and troughs). -
Trend Line Overlay
Separates directional bias from cyclical oscillations. -
Detected Cycles Info Panel
Displays detected cycle periods in an on-chart table.
- Traders seeking to anticipate cyclical turning points.
- Those who want a data-driven approach to market timing.
- Anyone combining cycle analysis with other technical tools for confluence.
Last Updated: 01/12/2024
1. Introduction
These Terms and Conditions ("Terms") govern your purchase, use, and resale (if applicable) of our Expert Advisor (EA) trading bots ("Products"). By purchasing or using our Products, you agree to comply with these Terms. If you do not agree with any part of these Terms, do not proceed with your purchase.
2. Risks and Disclaimer
The use of EA trading bots for automated trading involves significant risks, including but not limited to financial loss. Our Products are provided "as is," and we make no guarantees regarding performance, profitability, or success. You acknowledge and agree that you assume full responsibility for your trading decisions and any financial outcomes arising from the use of our Products.
3. Intellectual Property
All intellectual property rights to the Products remain with us. You are granted a limited, non-exclusive, non-transferable license to use the Products solely for your personal or business use, subject to these Terms.
4. Restrictions on Resale (White-Label Agreements)
If you purchase our Products under a white-label agreement:
- You may not resell the Products to other businesses or entities operating as businesses.
- Resale is permitted solely to retail customers (individuals).
- Failure to comply with this clause may result in immediate termination of your license without refund, and you may be held liable for damages arising from unauthorized resales.
5. No Warranty and Limitation of Liability
To the maximum extent permitted by law, we disclaim all warranties, express or implied, including but not limited to warranties of merchantability, fitness for a particular purpose, and non-infringement. In no event shall we be liable for any indirect, incidental, special, consequential, or punitive damages, including but not limited to loss of profits, data, or use, arising out of or related to the use or inability to use the Products.
6. Amendments
We reserve the right to update or modify these Terms at any time. Any changes will be effective immediately upon posting on our website. Your continued use of the Products constitutes acceptance of the modified Terms.
7. Contact Information
For any questions or concerns about these Terms, please contact us at[email protected].
Related products
You may be interested in one of our products.